

Without using an Elasticsearch frontend GUI you’ll be burdened crafting HTTP requests to query data. This article will cover how to use an ElasticSearch GUI client to connect to ElasticSearch (or OpenSearch) to query your data. It will refer to ElasticSearch and OpenSearch synonymously as OpenSearch.
Read this article before? Jump to the Sloth Summary for links and scripts!
ElasticSearch GUI v.s. OpenSearch GUI
Whether you are running OpenSearch locally in Docker, the ElasticSearch pre-compiled binaries, or OpenSearch in the cloud, the tools used to connect to a running cluster are exactly the same. Ultimately your choice(s) will culminate in a combination of connectivity and capability, with none completely taking the cake.
If you’re yet to join the Code Slothian revolution though, feel free to punish the efficiency of your workflow by using your favourite HTTP client. OpenSearch is a HTTP abstraction over Lucene, after all.
This article will cover my favourite tools (all of which are free), a summary of why I love them and enough information to get you up and running. In the sections related to Docker, you’ll be given the required command(s) to get you connected to your cluster.
Let’s go!
ElasticSearch Head Chrome Extension
The ElasticSearch Head Chrome extension is my favourite tool for working with OpenSearch. The original version was recently removed from the Google Chrome Web Store and has since been replaced with a new and improved distribution that allows you to connect to and remember multiple clusters.
Why I Love ElasticSearch Chrome Head
- Zero barrier to usage. You don’t need to run anything! It’s just a Google Chrome extension mouse click away in the top right hand corner of your browser.
- It optimises your workflow. It lets you quickly query data without having to physically write a query (or remember the syntax).
- It’s super compatible. It works (in most ways) with all versions of hosted ElasticSearch in AWS.
What’s Missing
- Persistence. If you are writing a structured query and choose another document field from the dropdown, the typed value in text box on that row disappears. Also, each time you close the browser tab it remembers your connection, but none of the values in the tabs that you were previously working on.
- Snapshot management. This tool would be even more amazing if it would let you administer cluster snapshots with a friendly GUI, rather than forcing you to use the
Any Requesttab to write a raw HTTP request to do the job for you.
Installation
- Open this link in Google Chrome.
- Install the extension.
- That’s it!
Pin the extension in your browser by clicking the jigsaw puzzle piece and then the pin icon next to its name. This way you’re only a single click away to jumping into a cluster – zero barrier to entry!
Running ElasticSearch Head Chrome Extension
After pinning the extension you’ll see a little green magnifying glass in the top right hand corner of Google Chrome. In the screenshot below you can see the old (left) and new (right) versions of the extension.

After starting OpenSearch in Docker, simply click the icon!
If you haven’t connected to a cluster yet, click the New button, enter the following URI and click OK.
http://localhost:9200
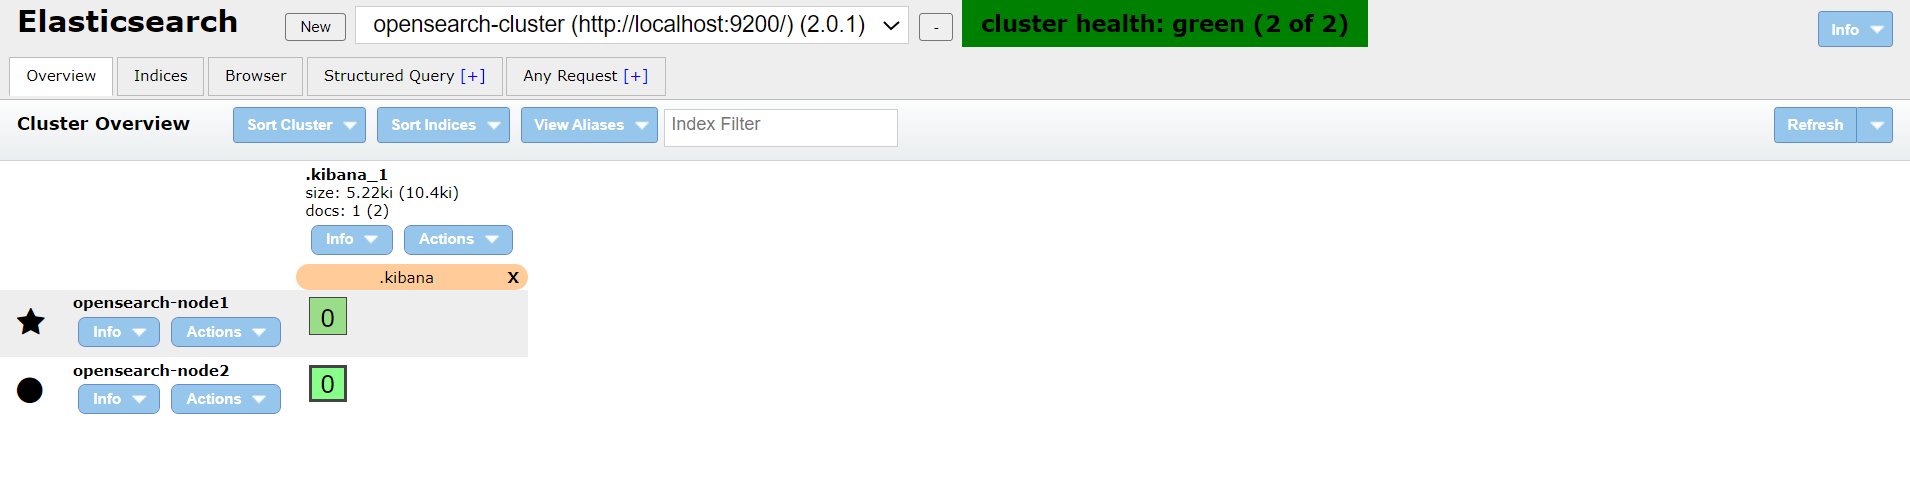
You’ll then be taken to the ElasticSearch Head Overview tab
There you have it! ElasticSearch Chrome Head in all of its glory. A simple browser based GUI that packs a punch with useful functionality. Not only does it give you a great visual summary of your cluster’s nodes (on the left) and indices (at the moment .kibana_1) on the homepage, but each tab has useful features that you’ll use on the daily!
Cerebro GUI in Docker
Cerebro is the kind of tool that makes you feel like you are working in the Matrix! It has a sleek dark grey colour palette that is complemented with pops of vibrant green and teal.
Why I Love Cerebro
- Snapshot management. If ElasticSearch head had the convenient snapshot management of Cerebro, I’d ditch Cerebro altogether. But it doesn’t. And in all fairness, Cerebro does an awesome job of providing a clean GUI to manage snapshots, so keep a slot in your toolbelt for it.
- Telemetry. This point is a bit of a novelty given that AWS exposes copious amounts of telemetry for a hosted OpenSearch cluster. However, Cerebro’s overview page contains some stats about heap, disk space, CPU and load for each node in the cluster; not that you really care about that when running it locally.
What’s Missing
- Structured queries. Cerebro doesn’t have the speed and convenience of ElasticSearch Head’s Browser or Structured Query tabs. ElasticSearch Head truly shines when it comes to quickly getting you to a document. No true Code Sloth wants to have to type out an entire search query to find what they are looking for when investigating their data.
- Versioning issues. In the early versions of AWS managed ElasticSearch (any version prior to 5.1) the cluster state endpoint that Cerebro polls doesn’t exist. After each failed request you’re annoyingly sent back to the login screen. This makes it impossible to use with older versions of ElasticSearch. For supported operations of ElasticSearch and OpenSearch in AWS check out this link.
Installation
Cerebro in Docker requires no installation other than Docker itself, which is covered in this article.
Connecting to a Local OpenSearch Cluster that is Running in Docker
There are a few different ways to connect to your cluster with Cerebro based on your use case.
Option 1: Running Cerebro in Docker on the command line
This option is preferable to the latter if Cerebro is not something that you often work with. With this approach you create and tear down a Cerebro container on-demand with a handy PowerShell script. This keeps your workflow optimal by avoiding unnecessary container management in Docker via the command line or UI.
Copy the following command and save it into a PowerShell script called run-cerebro.ps1. Open a PowerShell terminal in the file’s folder and run it.
docker run -it --rm --name cerebro --net opensearch_opensearch-net -p 9000:9000 lmenezes/cerebro
This command is loaded with parameters that are discussed in my tutorial on cross container networking with Docker, which you should come back to later.
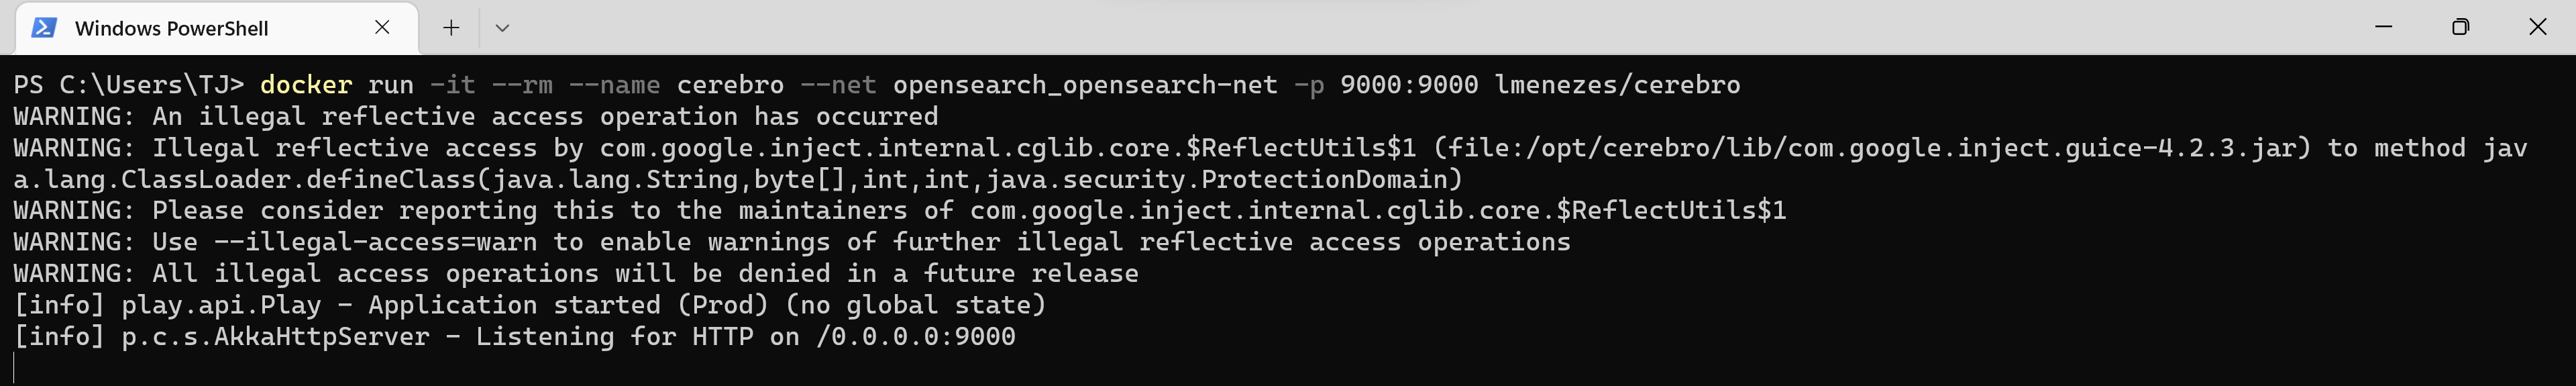
Running the script will produce several lines of output on the console. After a short pause the listening on port 9000 message will be displayed, at which point you can continue
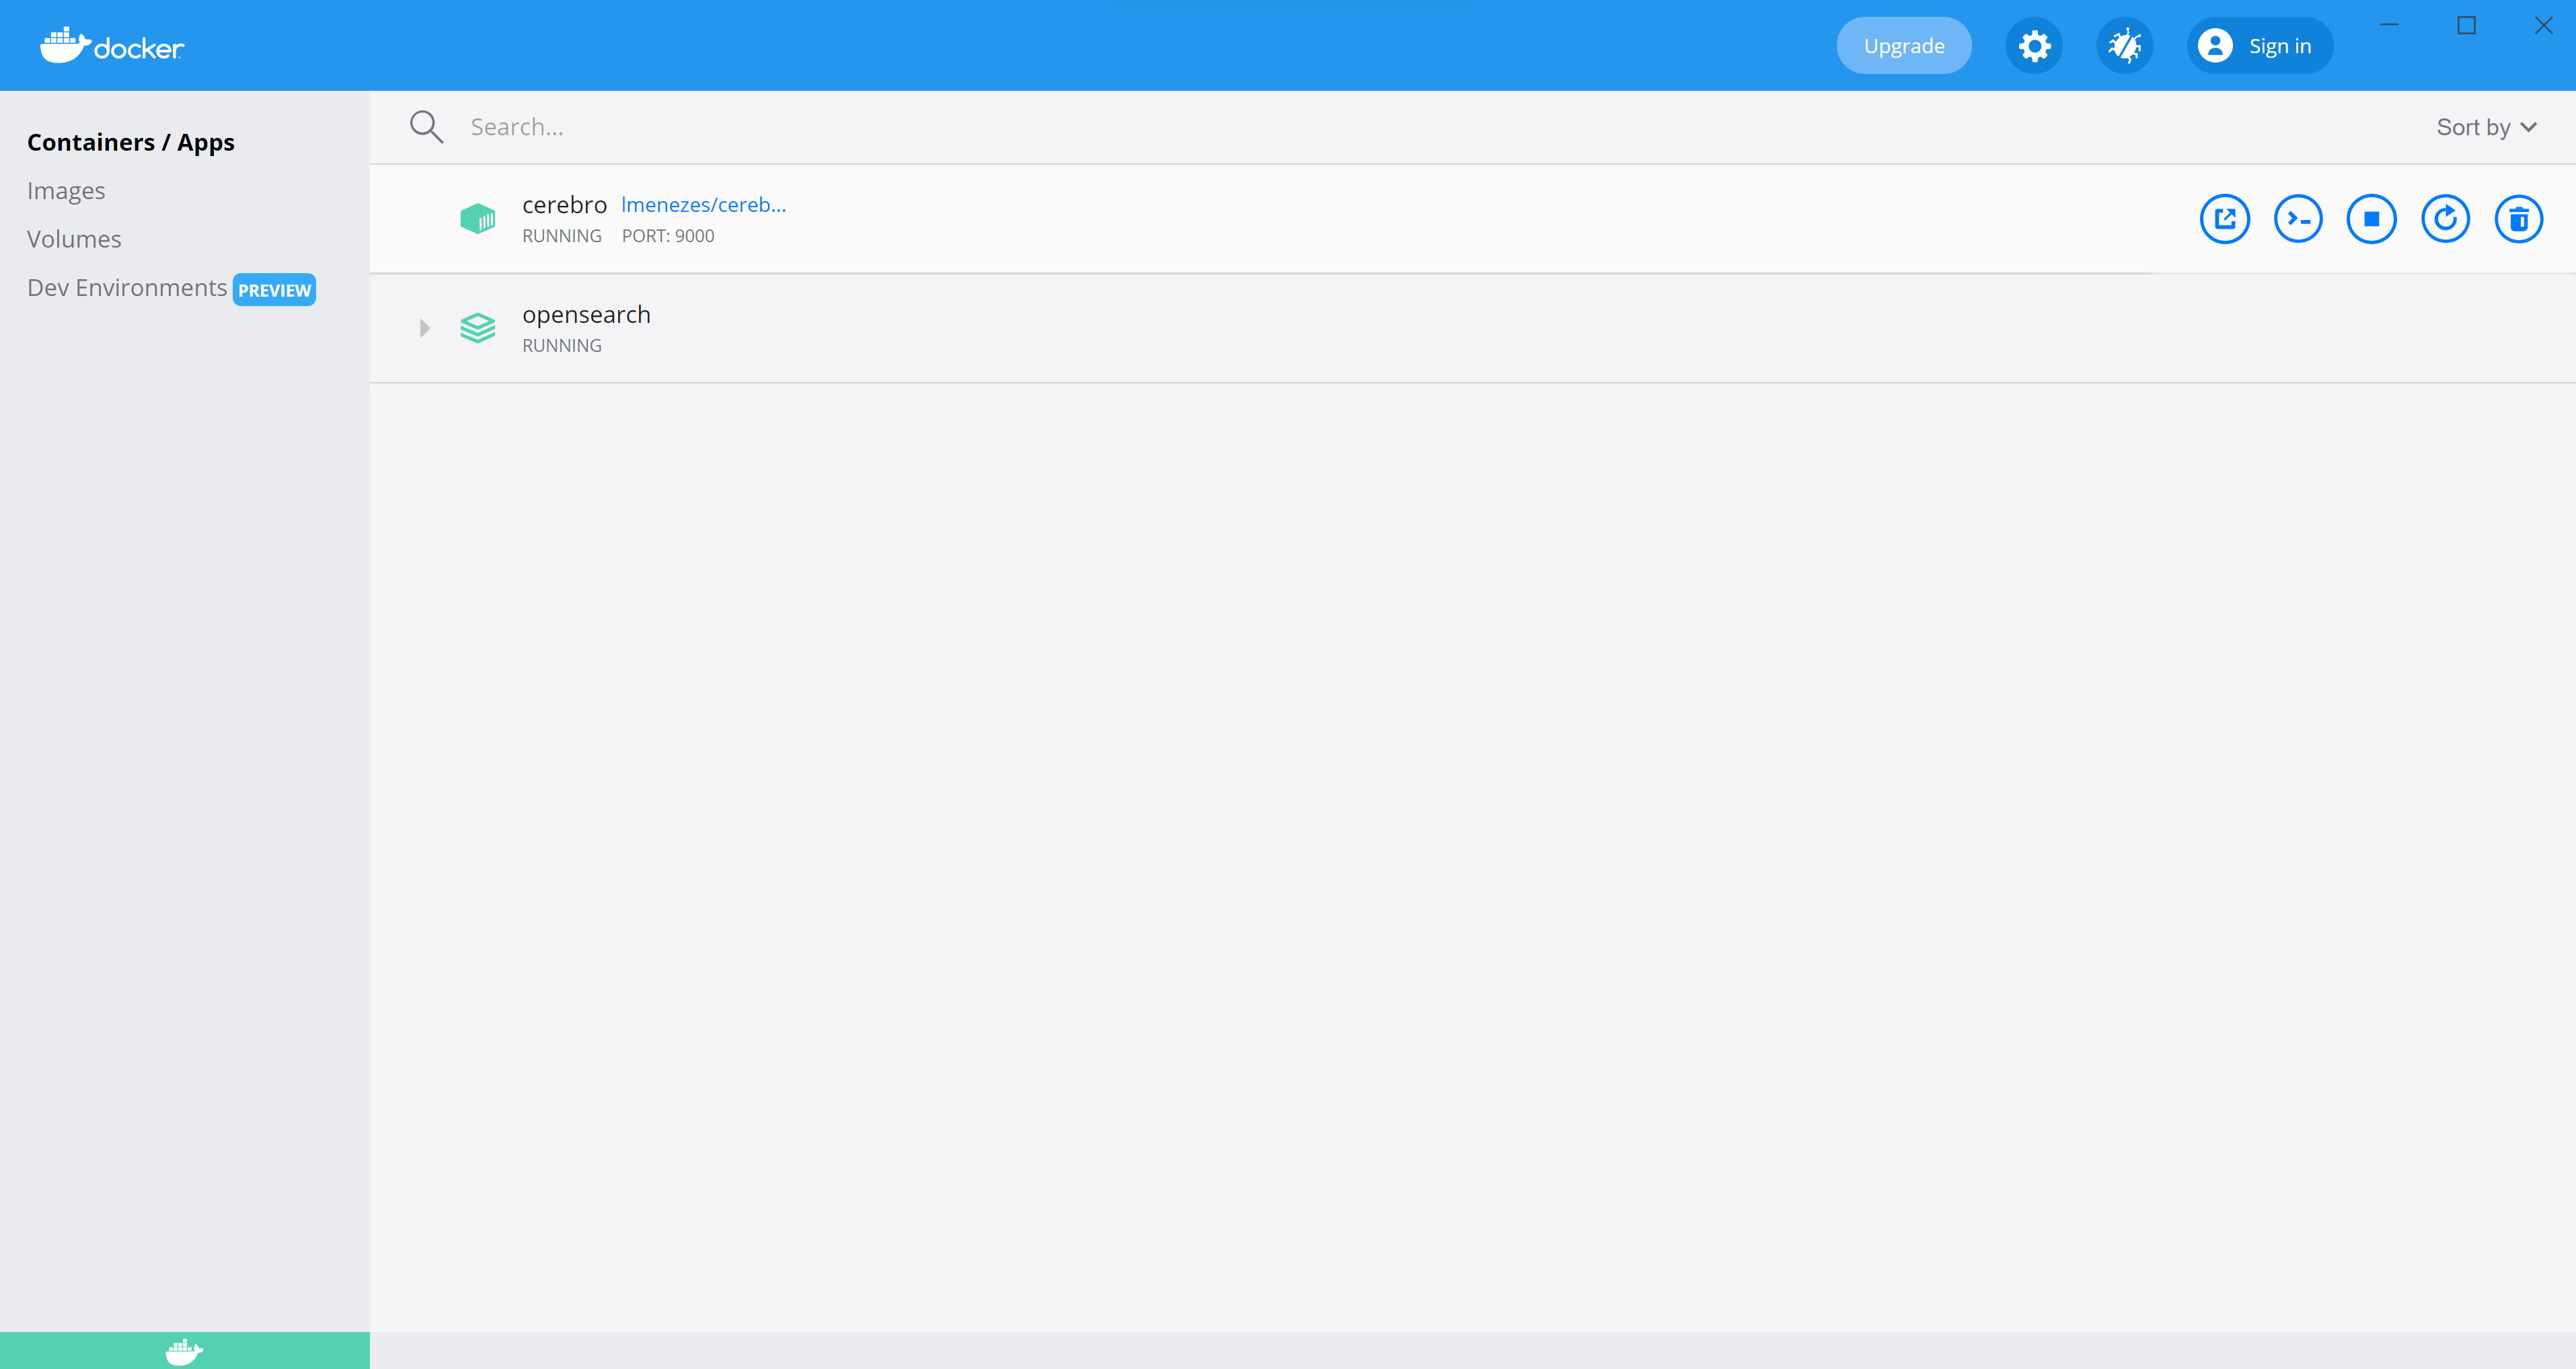
If you open the Docker Dashboard, by opening the system tray -> right clicking the Docker whale icon and selecting Dashboard, you will see your new container called cerebro running, with port 9000 exposed
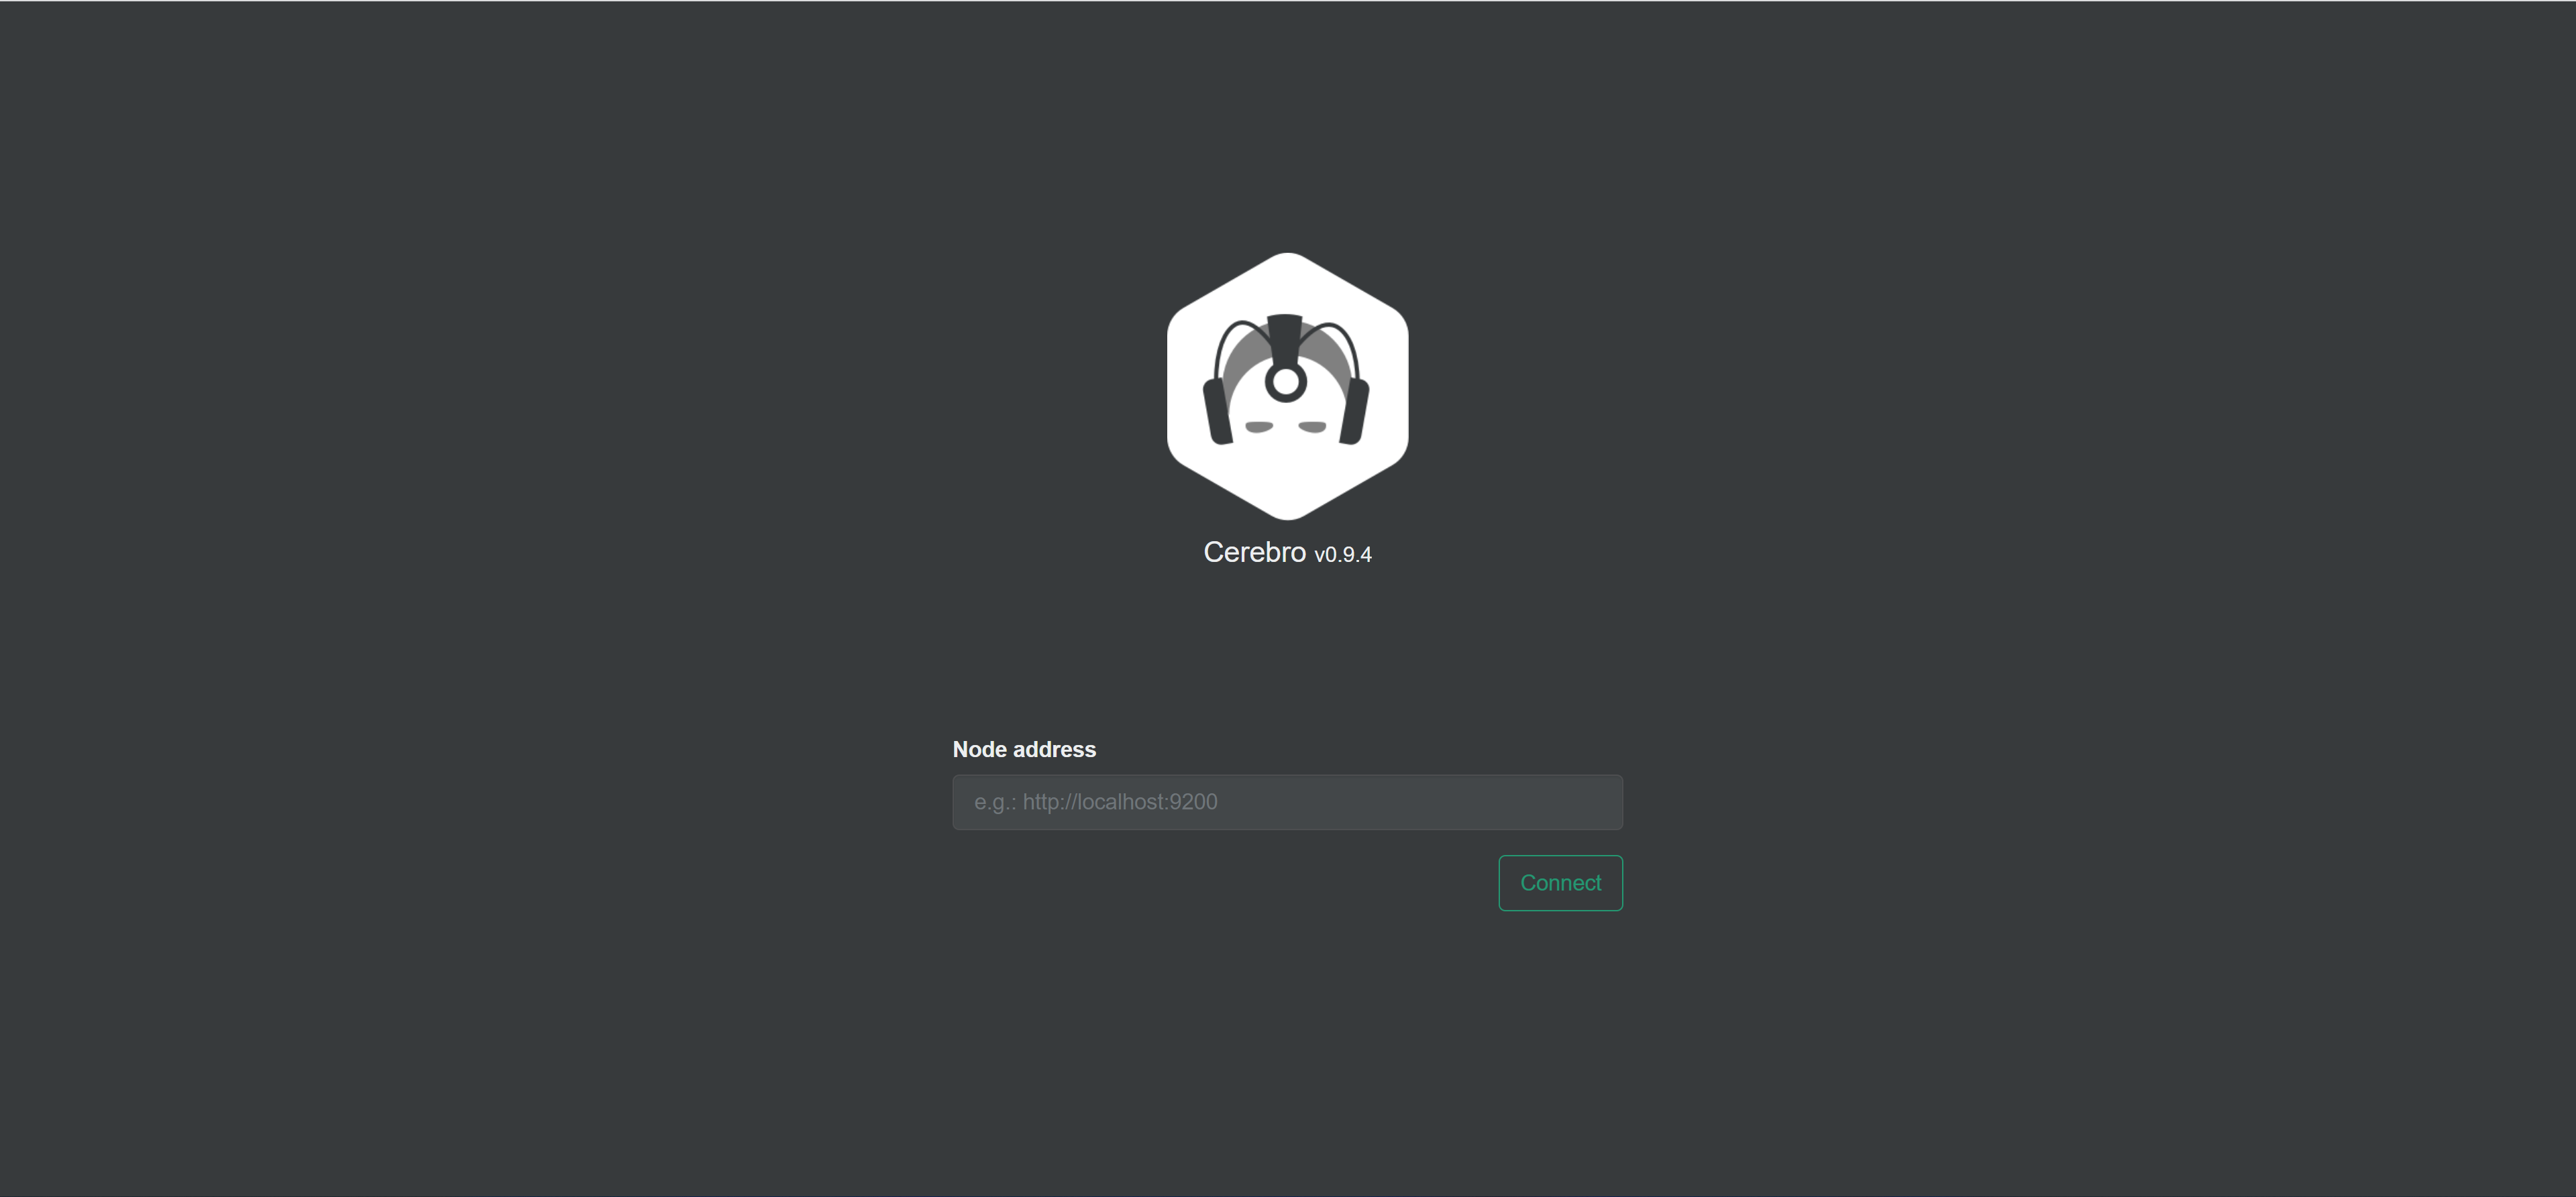
To use Cerebro, open your web browser and navigate to the URI below. The Cerebro welcome screen will load.
http://localhost:9000
Here’s where things get a little tricky. A more comprehensive tutorial on Docker container to container networking can be found here, for some later reading.
Cerebro is currently running in a Docker container, which means that we can’t connect to OpenSearch using http://localhost:9200. This is because localhost would refer to the inside of the container which isn’t where OpenSearch is running. Instead we need to connect to port 9200 exposed via the OpenSearch container.
The simplest way to achieve this is to join the same network as our target container and use its name in lieu of localhost. The Docker command above joins your Cerebro container to the network defined in the docker-compose.yml file in the Sloth Summary.
You can track down the target container’s name in a few different ways:
- Opening the
Docker Dashboardand expanding the OpenSearch compose container collection. - Running
docker container lsand finding the container that exposes port 9200 from the list. This will return an empty list if you stopped the compose collection, so make sure it’s up and running. - Finding the container name in the
docker-composefile.
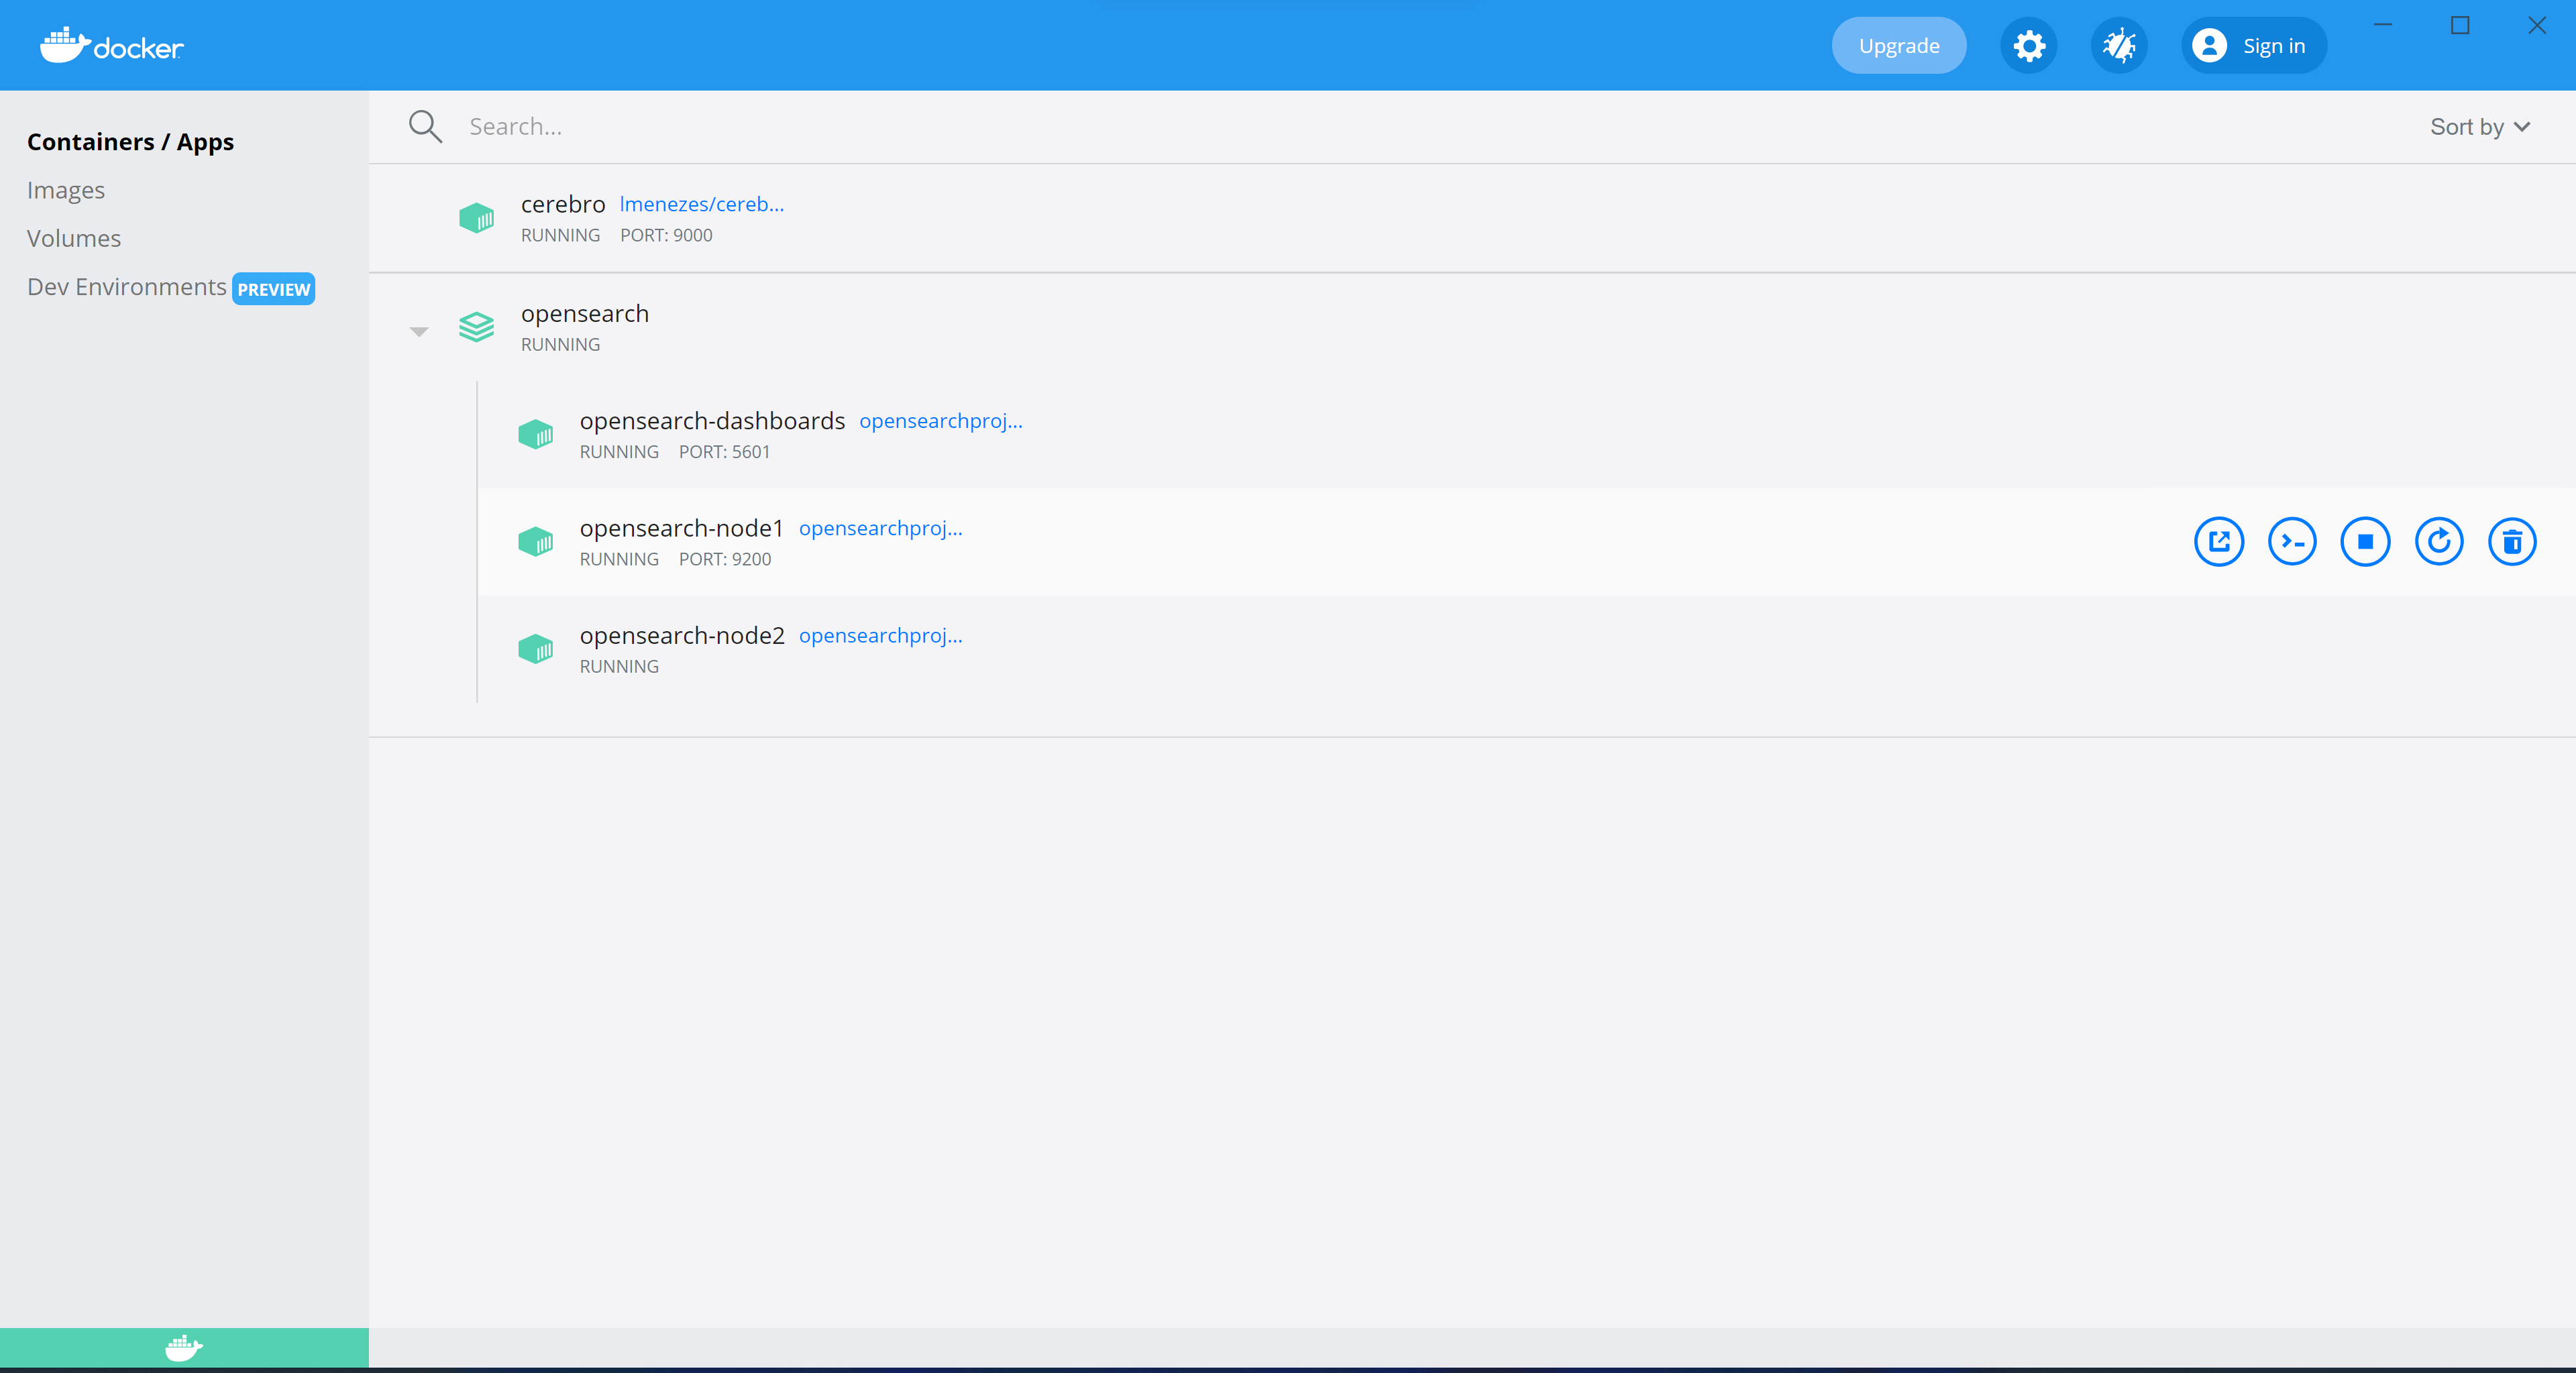
We can see above that the container which exposes port 9200 is called opensearch-node1
Therefore, in order to connect to it with Cerebro (which we joined to the network that was created via the compose file) we use:
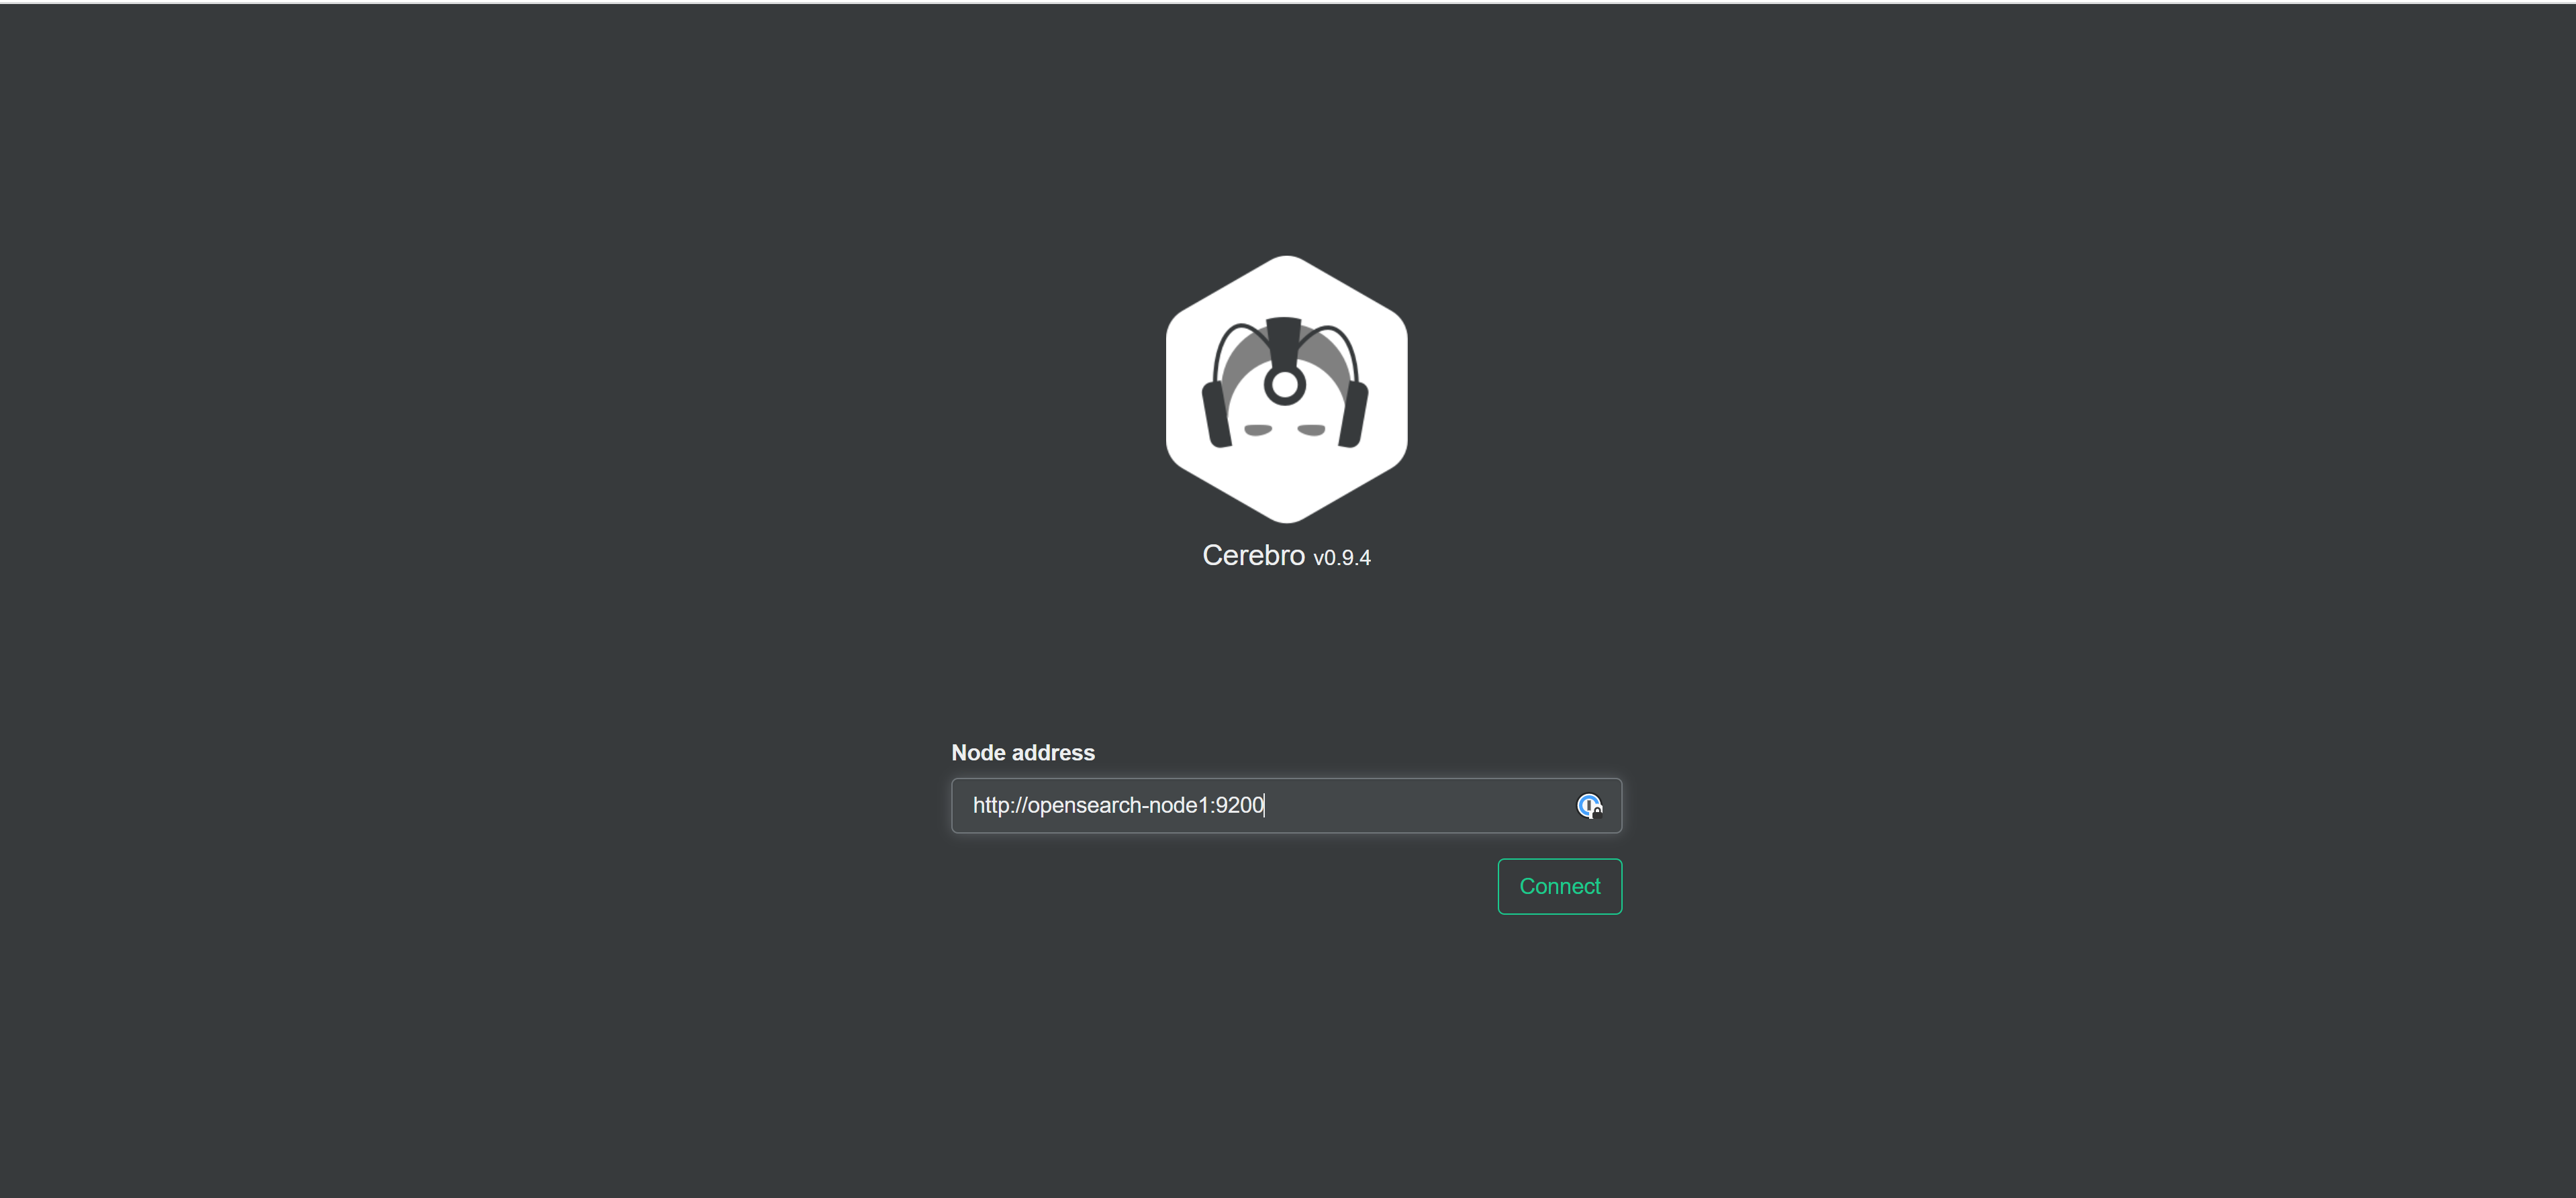
http://opensearch-node1:9200
You could also connect to the container by its IP Address, however this would involve more steps for the same outcome.
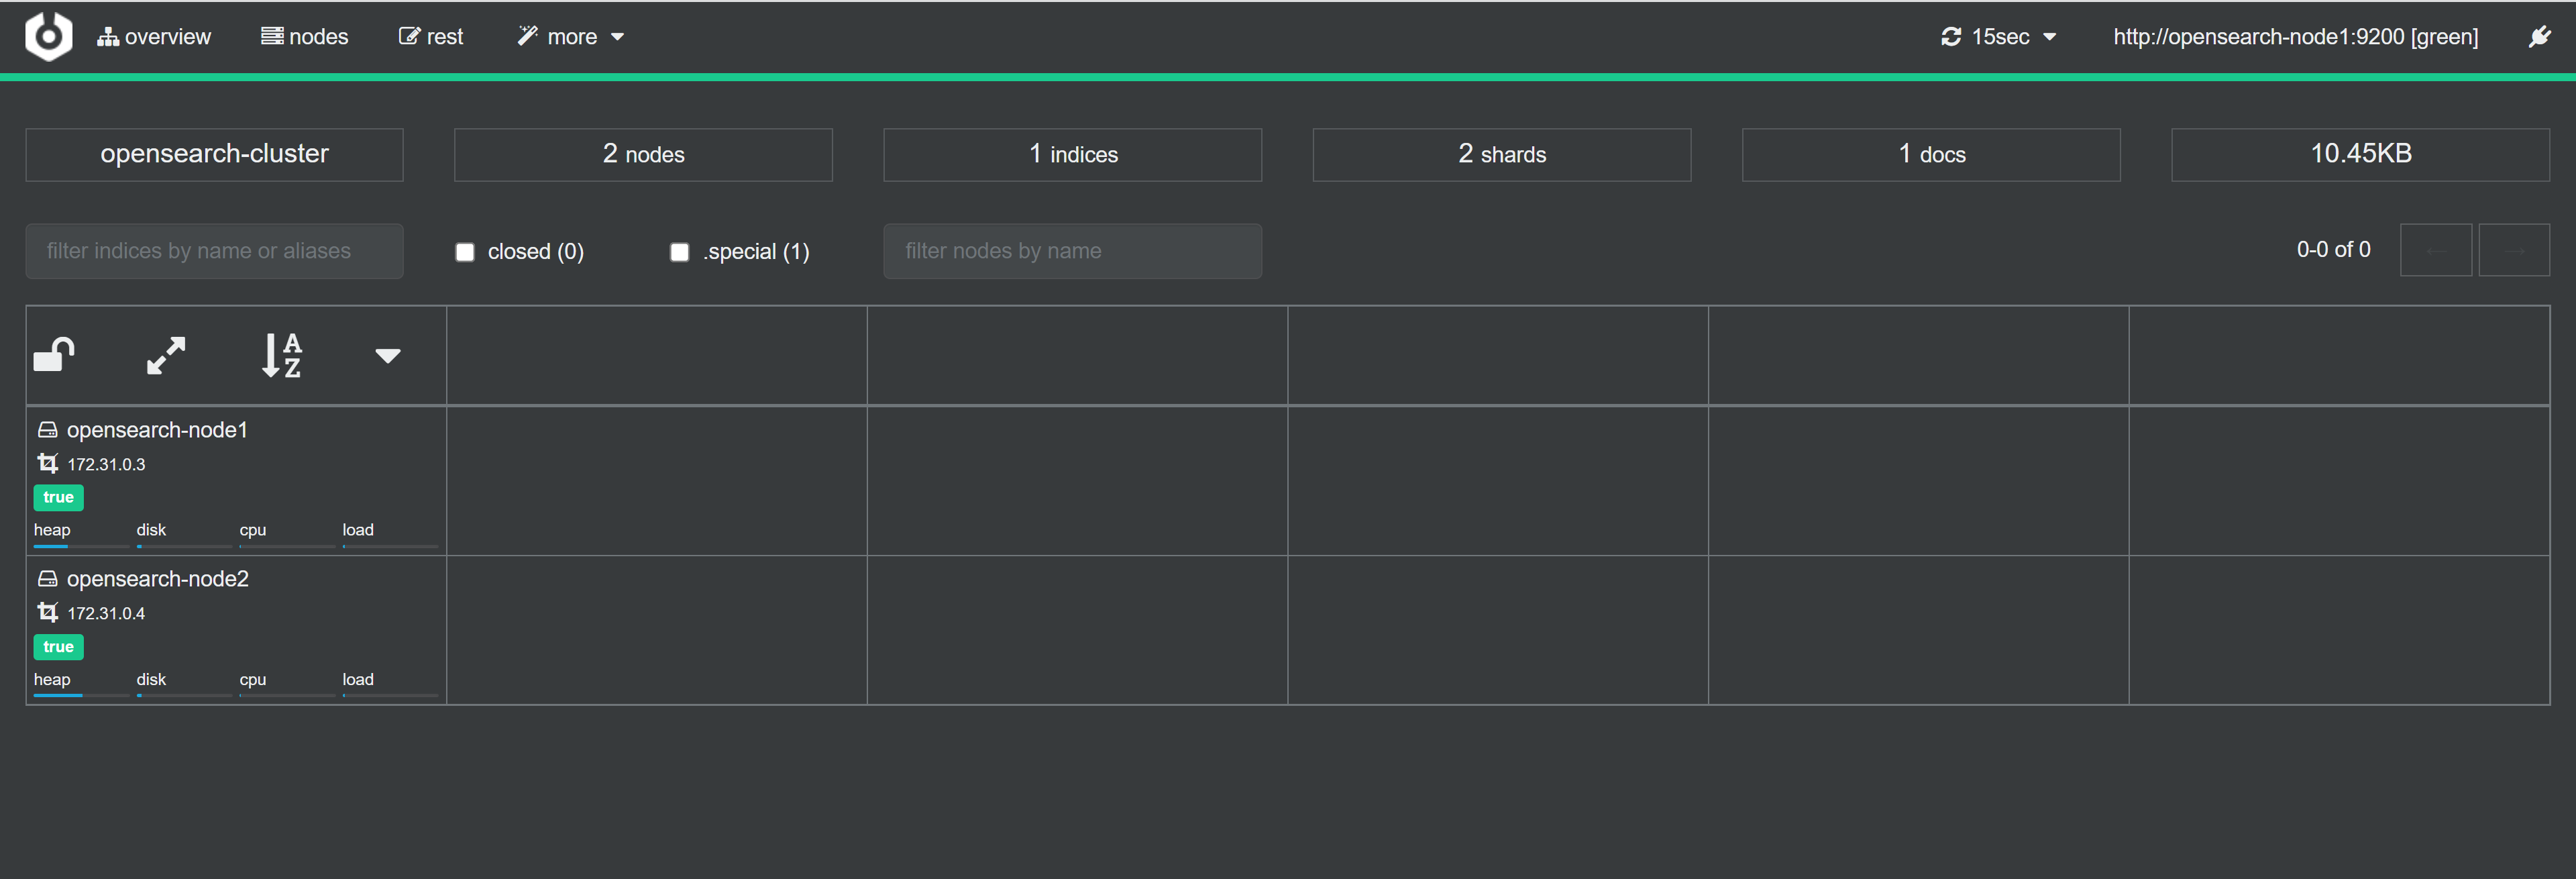
Click connect and you’ll be taken to the Cerebro dashboard. What a journey!
The overview page shows you the nodes on the left hand side, with indices at across the top. Note that you’ll need to click the .special checkbox to see special indices such as .Kibana which we saw by default in ElasticSearch Head above.
Option 2: Running Cerebro in Docker through Docker Compose
With a few lines added to your existing docker-compose.yml file you’ll be able to ensure that Cerebro is always up and running beside your cluster.
cerebro:
  container_name: cerebro
  image: lmenezes/cerebro
  ports:
    - 9000:9000
  networks:
    - opensearch-net
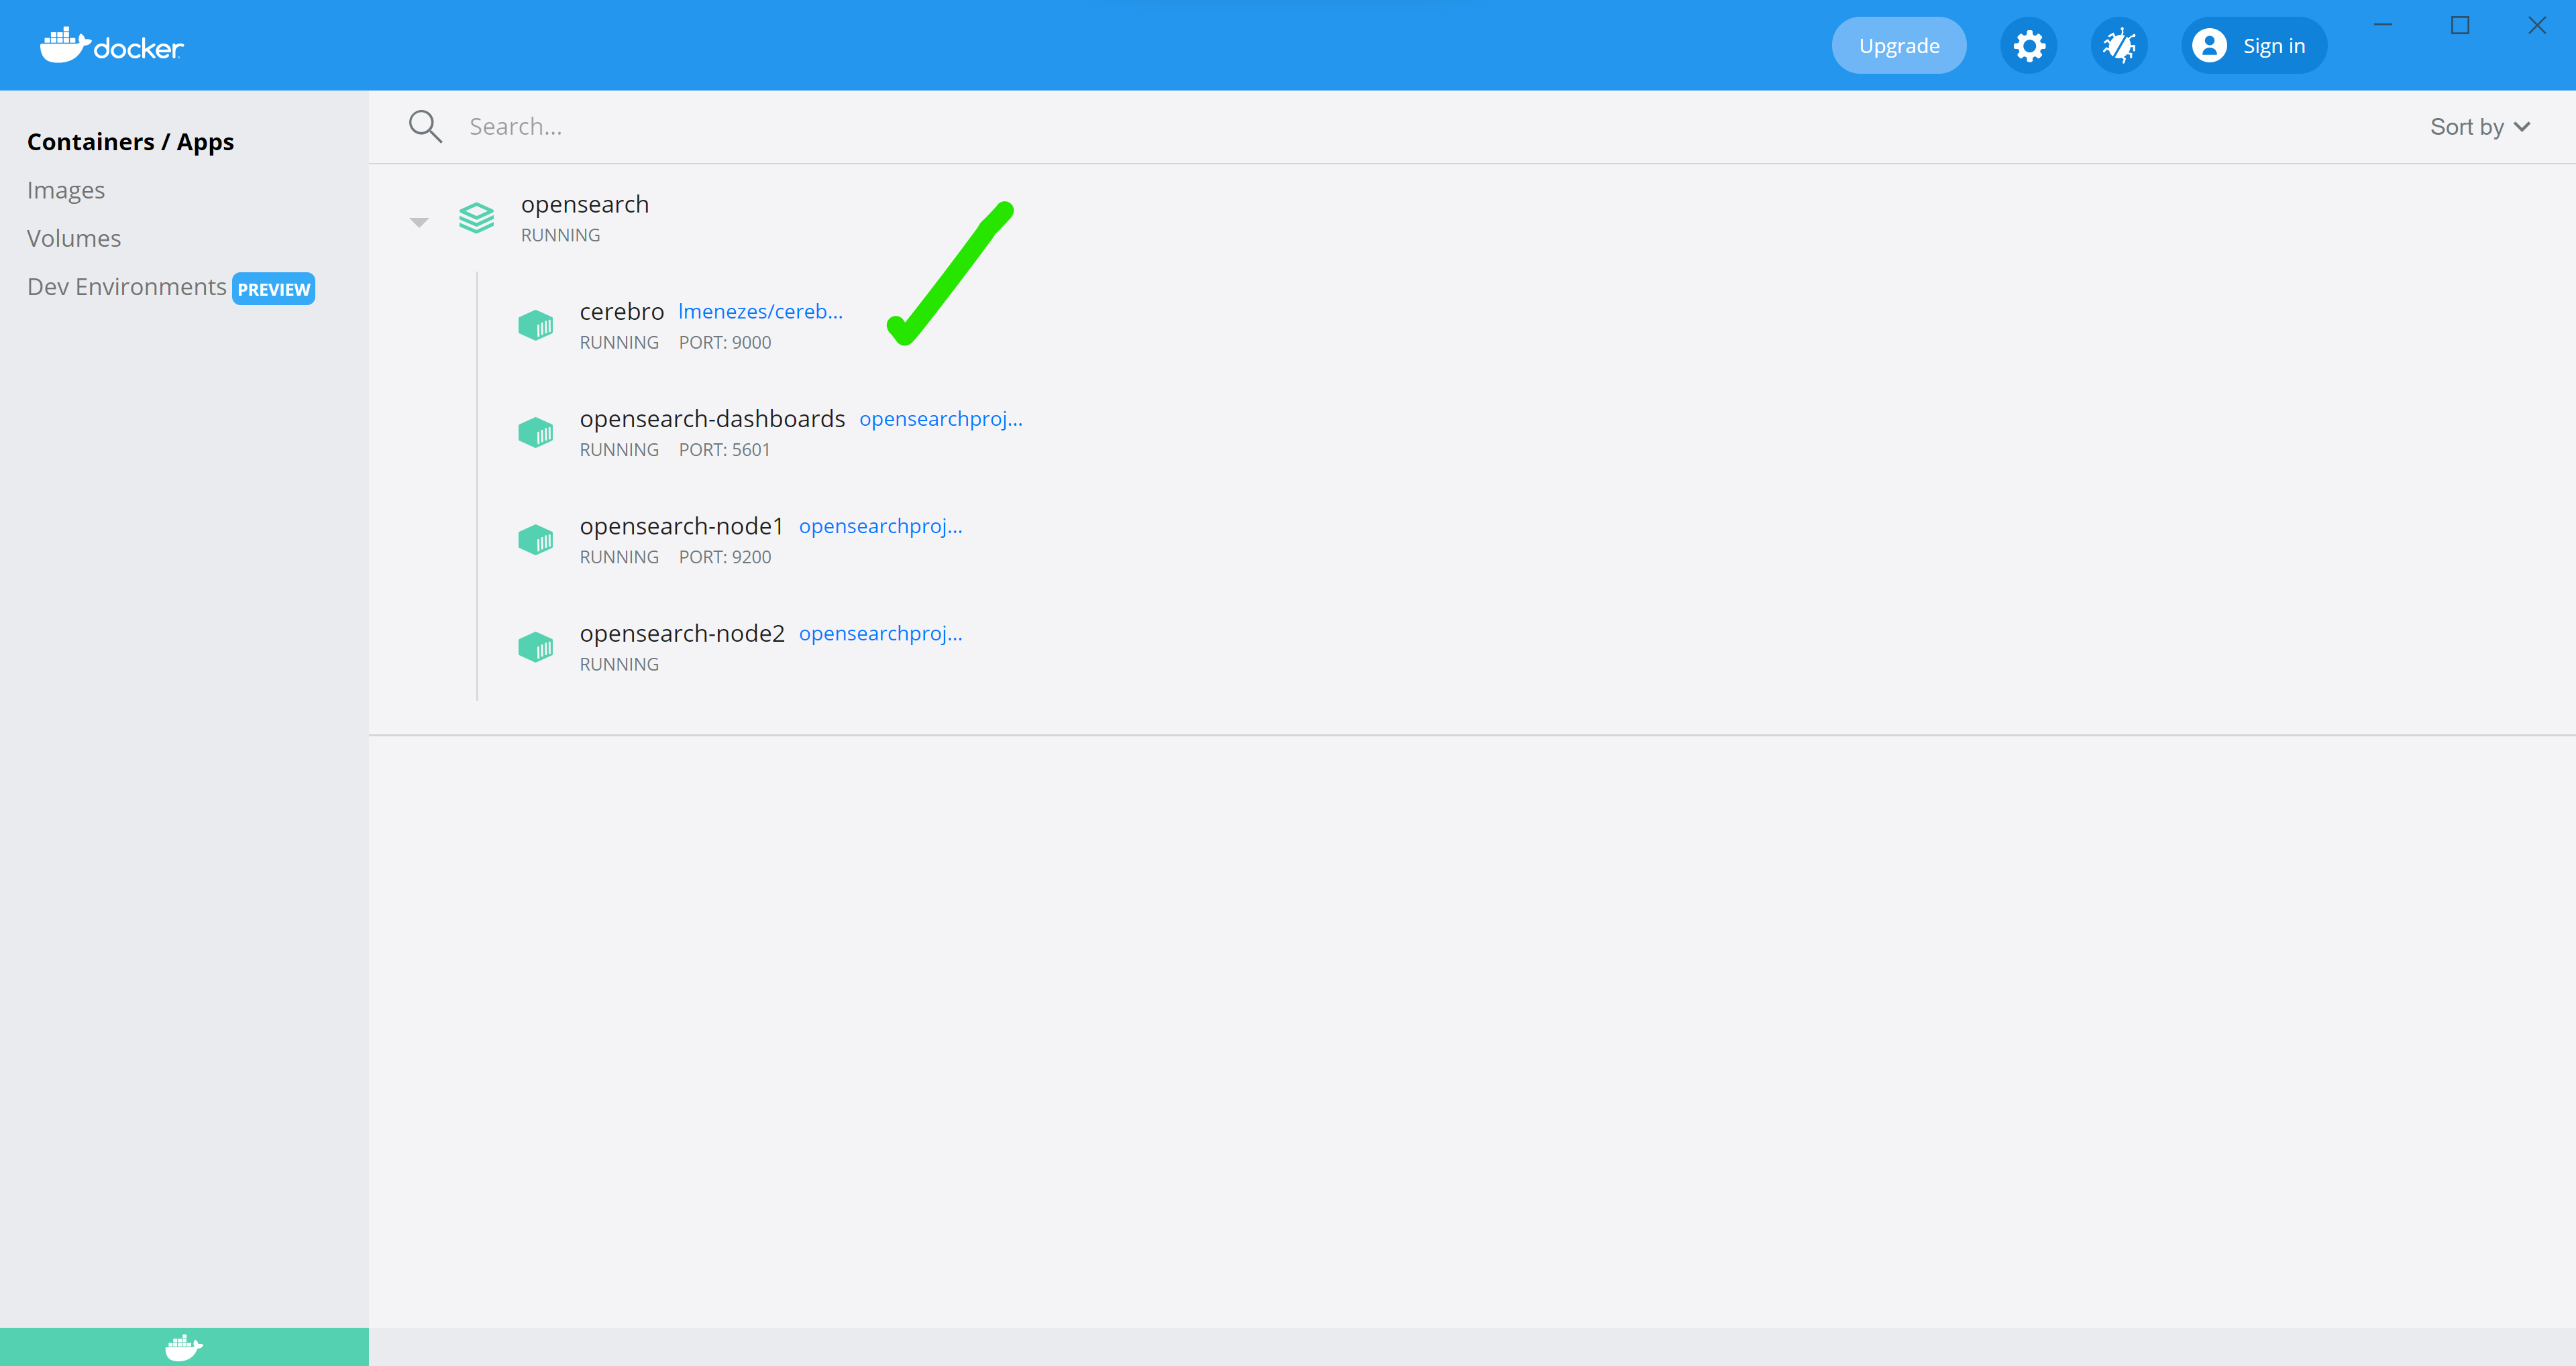
The outcome is exactly the same as running the command above, except when you open the Docker Dashboard, you’ll see another nested container running under the OpenSearch collection
A full copy of the updated docker-compose.yml file can be found in the Sloth Summary at the bottom of this article.
Connecting to a Local ElasticSearch Cluster running in Windows
The command required to a local ElasticSearch cluster is simpler than OpenSearch.
docker run -it --rm --name cerebro -p 9000:9000 lmenezes/cerebro
This command is a subset of the one used for OpenSearch. We simply omit the network information because ElasticSearch is not running in a container.
To connect to the cluster on the Cerebro welcome screen we enter the following:
http://host.docker.internal:9200
host.docker.internal refers to the host machine that the container is running on.
Connecting to AWS Managed OpenSearch Cluster: Running Cerebro in Docker on the Command Line
This strategy is simpler than all of the above. Run the following command to start cerebro
docker run -it --rm --name cerebro -p 9000:9000 lmenezes/cerebro
Then, simply enter the public URI to the Cluster which can be found on its overview page. No port is required, just copy paste the URI from the AWS Console and you’re good to go!
OpenSearch Dashboards GUI
OpenSearch Dashboards (formerly known as Kibana) is something that comes in handy for dashboarding and visualisation (if your data lends itself to time series modelling), but really shines through its OpenSearch query retention.
Why I Love OpenSearch Dashboards
- Command retention. The Dev Tools Console saves what you have previously written each time you close it. This means that your previous session is restored and ready to go each time you open it! Be it commands to migrate data between indices or simple alias swaps, this remembrance will not only save you a lot of typing over time, but a lot of time spent referencing documentation.
- Intellisense. It is not always simple to draft an OpenSearch query. Having intellisense by your side can save you time typing and also helps to ensure that you don’t have a pesky typo that needs debugging!
What’s Missing
- Structured queries. Much like Cerebro OpenSearch Dashboards doesn’t come baked with structured queries to quickly retrieve documents. The flip side of this is that if you have a frequently structured queries, you can just cache them and reuse them with different filter data.
- Snapshot management GUI. Because OpenSearch Dashboards Dev Tools Console is a raw query editor, there’s no streamlined GUI for doing snapshot management, like in Cerebro.
Installation
The docker-compose.yml file in the Sloth Summary of this article runs OpenSearch Dashboards automatically for you. No manual installation required!
Runnning OpenSearch Dashboard
Simply navigate to the URI below.
http://localhost:5601
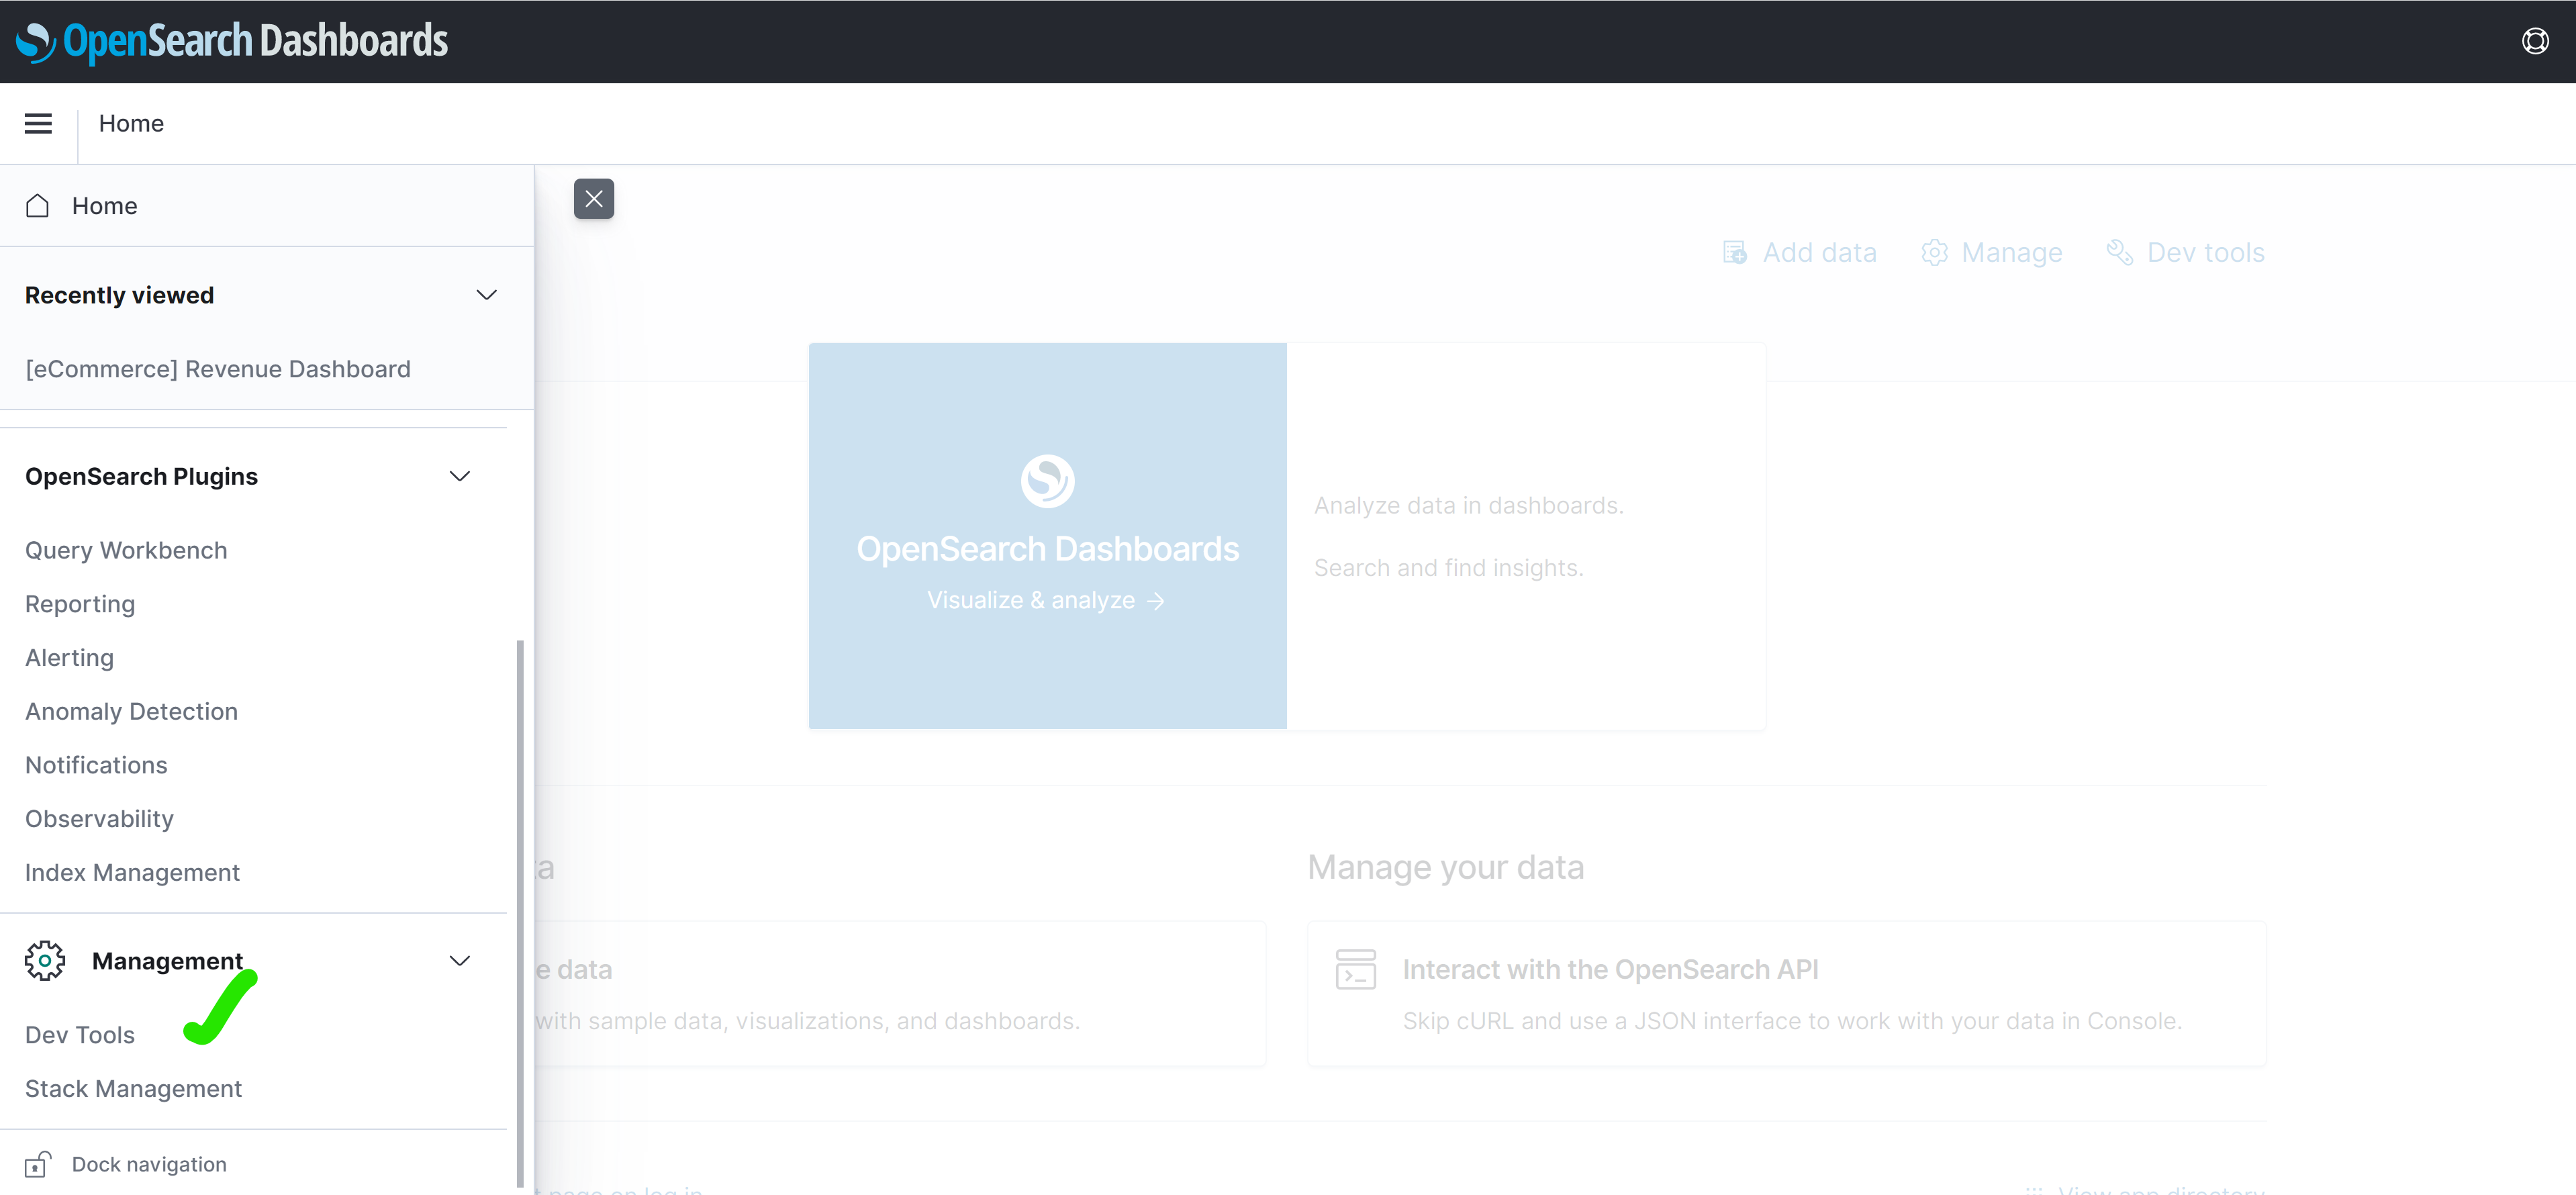
From there, open the side panel by clicking the hamburger icon, then scroll to the bottom of the list and click on Dev Tools
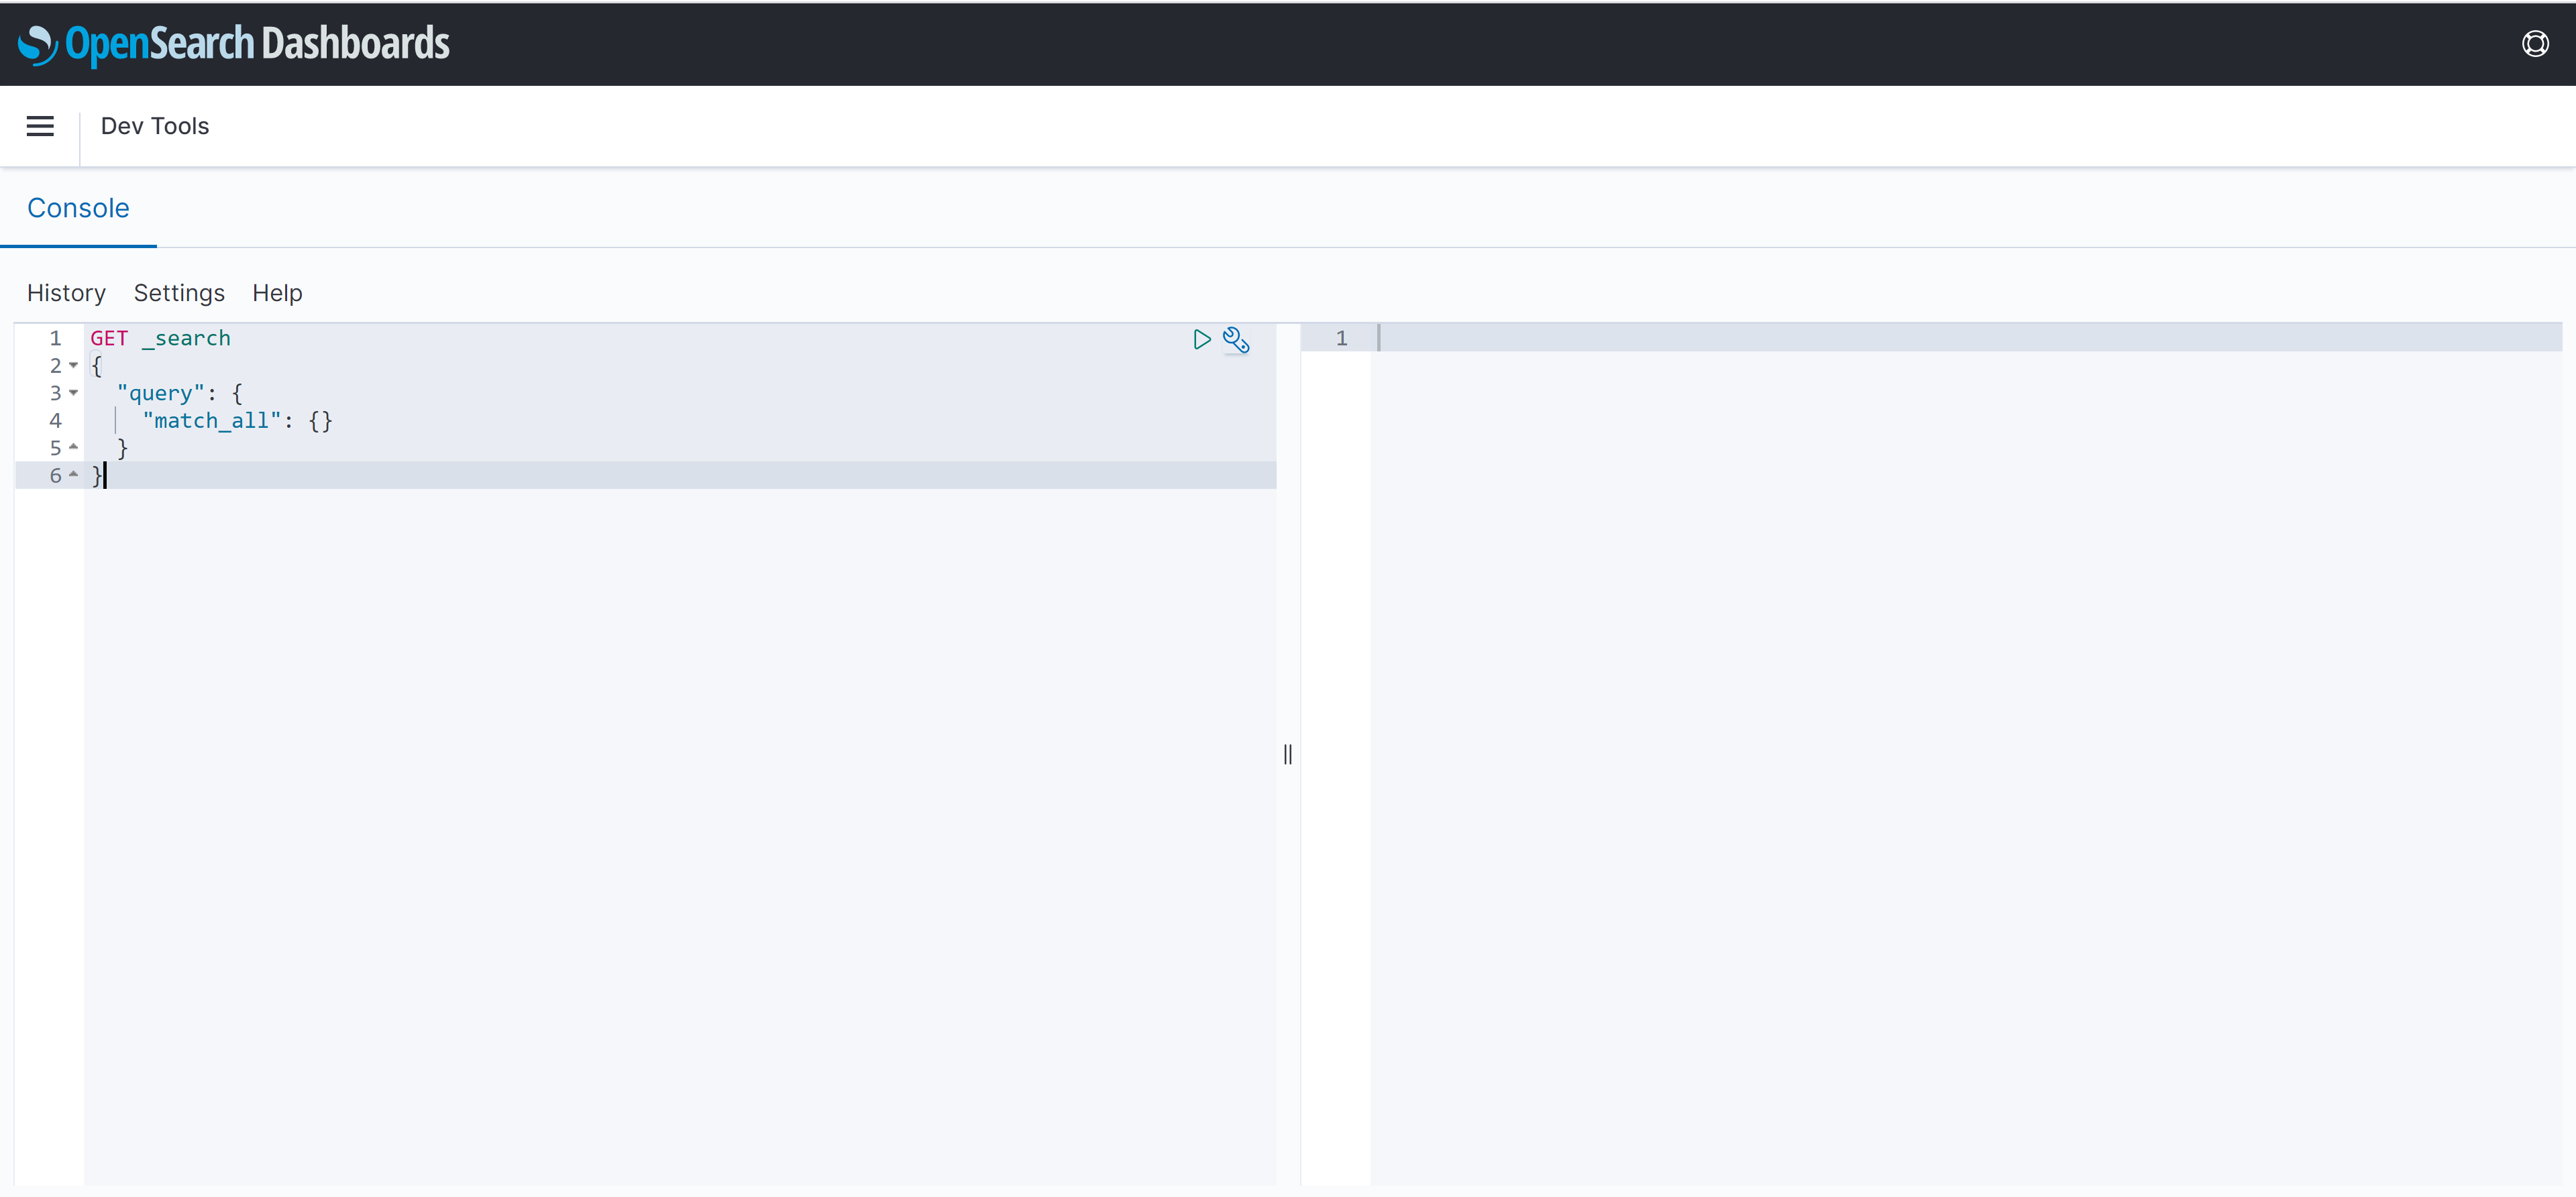
Then you’ll be taken into the scripting window. Easy!
Sloth Summary
As you can see there’s really no one-size-fits-all OpenSearch tool. Despite this though, the combination of the three tools above should be more than enough to get your through your day to day use cases!
Elasticsearch GUI 1: Multi ElasticSearch Head
Link to Google Chrome extension: https://chrome.google.com/webstore/detail/multi-elasticsearch-head/cpmmilfkofbeimbmgiclohpodggeheim?hl=en
Elasticsearch GUI 2: Cerebro
Link to open Cerebro from command/compose below.
http://localhost:9000
Option 1 – Connecting Cerebro to OpenSearch via Command Line
docker run -it --rm --name cerebro --net opensearch_opensearch-net -p 9000:9000 lmenezes/cerebro
Option 2 – Cerebro Full Docker Compose File
version: '3'
services:
  cerebro:
    container_name: cerebro
    image: lmenezes/cerebro
    ports:
      - 9000:9000
    networks:
      - opensearch-net
  opensearch-node1:
    image: opensearchproject/opensearch:2.0.1
    container_name: opensearch-node1
    environment:
      - cluster.name=opensearch-cluster
      - node.name=opensearch-node1
      - discovery.seed_hosts=opensearch-node1,opensearch-node2
      - cluster.initial_master_nodes=opensearch-node1,opensearch-node2
      - bootstrap.memory_lock=true # along with the memlock settings below, disables swapping
      - "OPENSEARCH_JAVA_OPTS=-Xms512m -Xmx512m" # minimum and maximum Java heap size, recommend setting both to 50% of system RAM
      - plugins.security.disabled=true # additional configuration to disable security by default for local development
    ulimits:
      memlock:
        soft: -1
        hard: -1
      nofile:
        soft: 65536 # maximum number of open files for the OpenSearch user, set to at least 65536 on modern systems
        hard: 65536
    volumes:
      - opensearch-data1:/usr/share/opensearch/data
    ports:
      - 9200:9200
      - 9600:9600 # required for Performance Analyzer
    networks:
      - opensearch-net
  opensearch-node2:
    image: opensearchproject/opensearch:2.0.1
    container_name: opensearch-node2
    environment:
      - cluster.name=opensearch-cluster
      - node.name=opensearch-node2
      - discovery.seed_hosts=opensearch-node1,opensearch-node2
      - cluster.initial_master_nodes=opensearch-node1,opensearch-node2
      - bootstrap.memory_lock=true
      - "OPENSEARCH_JAVA_OPTS=-Xms512m -Xmx512m"
      - plugins.security.disabled=true # additional configuration to disable security by default for local development
    ulimits:
      memlock:
        soft: -1
        hard: -1
      nofile:
        soft: 65536
        hard: 65536
    volumes:
      - opensearch-data2:/usr/share/opensearch/data
    networks:
      - opensearch-net
  opensearch-dashboards:
    image: opensearchproject/opensearch-dashboards:2.0.1
    container_name: opensearch-dashboards
    ports:
      - 5601:5601
    expose:
      - "5601"
    environment:
      - 'OPENSEARCH_HOSTS=["http://opensearch-node1:9200","http://opensearch-node2:9200"]'
      - "DISABLE_SECURITY_DASHBOARDS_PLUGIN=true" # disables security dashboards plugin in OpenSearch Dashboards
    networks:
      - opensearch-net

volumes:
  opensearch-data1:
  opensearch-data2:

networks:
  opensearch-net:
Connecting Cerebro to local ElasticSearch or AWS Hosted OpenSearch
docker run -it --rm --name cerebro -p 9000:9000 lmenezes/cerebro
Elasticsearch GUI 3: OpenSearch Dashboard
Link to open OpenSearch Dashboard from docker-compose.yml above.
http://localhost:5601